Every feature, in detail.
Eight panels that wrap your bias, your levels, your sizing, your journal, and your daily plan into one fast UI. Scroll through, screenshots and all.
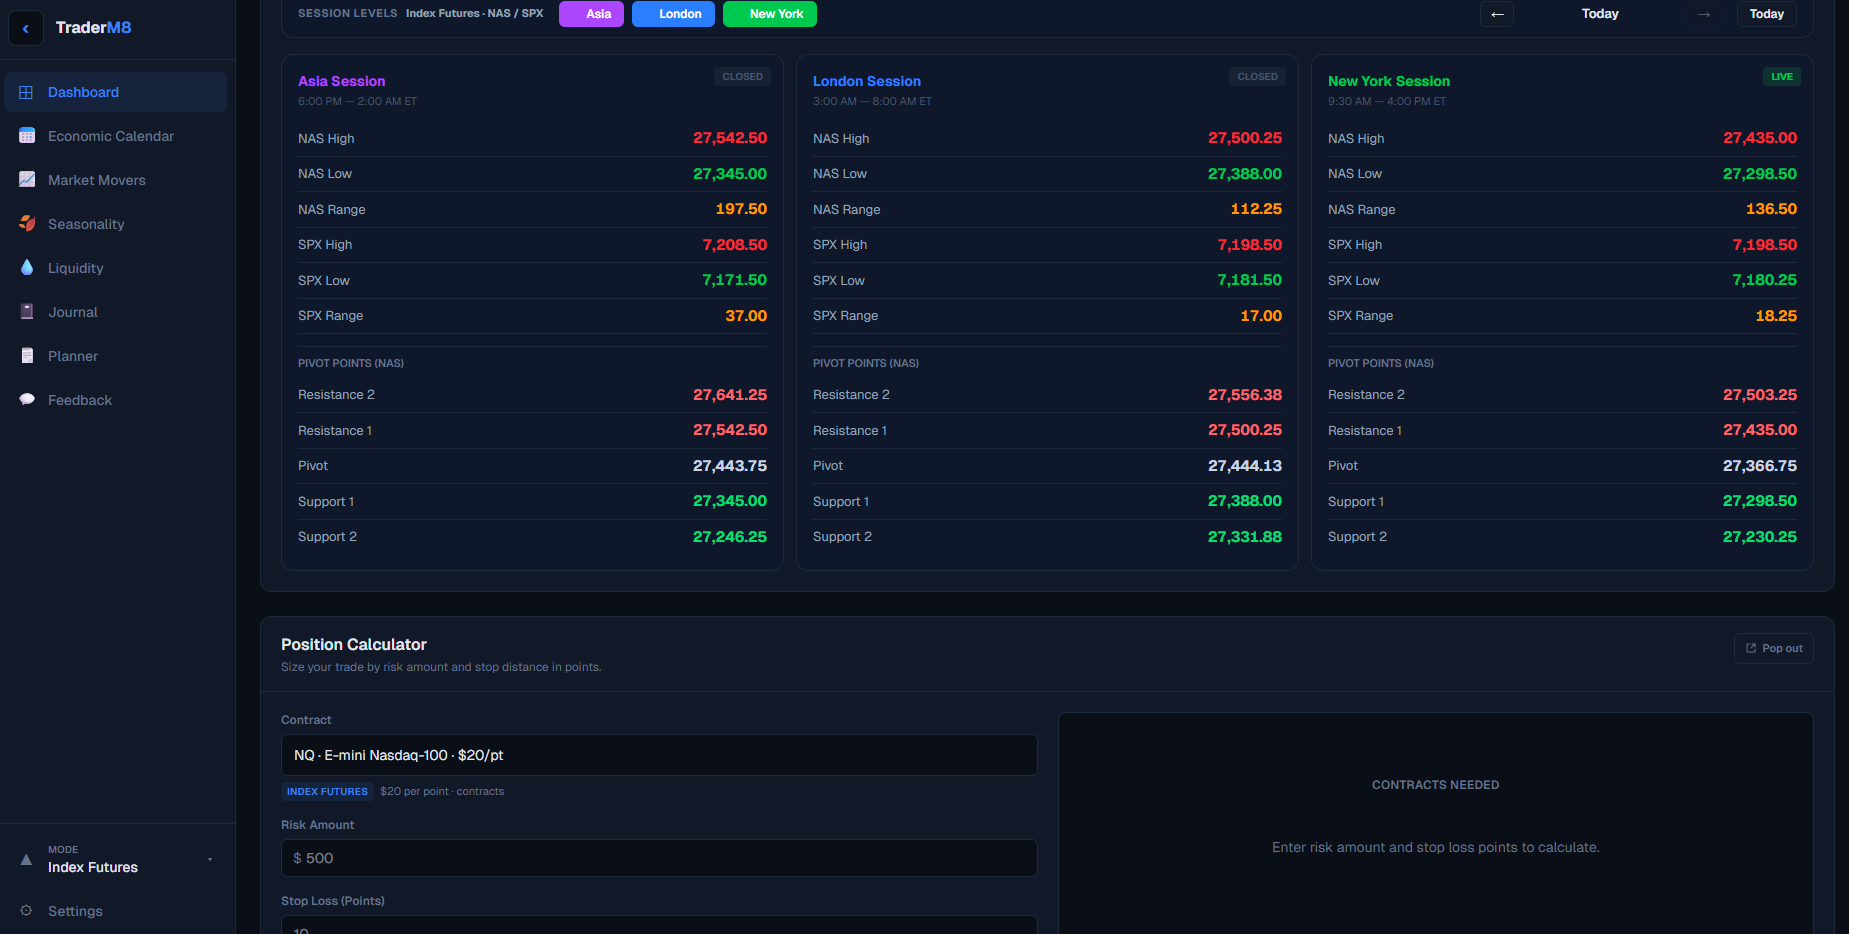
See which way the model reads the market, before you plan a trade.
ICT/SMC bias cards refresh on every candle close across NQ, ES, Gold, BTC and EUR/USD. Session H/L for Asia, London and New York lift onto the dashboard with pivot points calculated, so you stop drawing rectangles by hand at 3am.
- Mode-aware: flip to Crypto and the whole dashboard re-skins.
- Pivots, ranges, and live/closed status per session.
- Header tells you exactly which session is open, in your time zone.
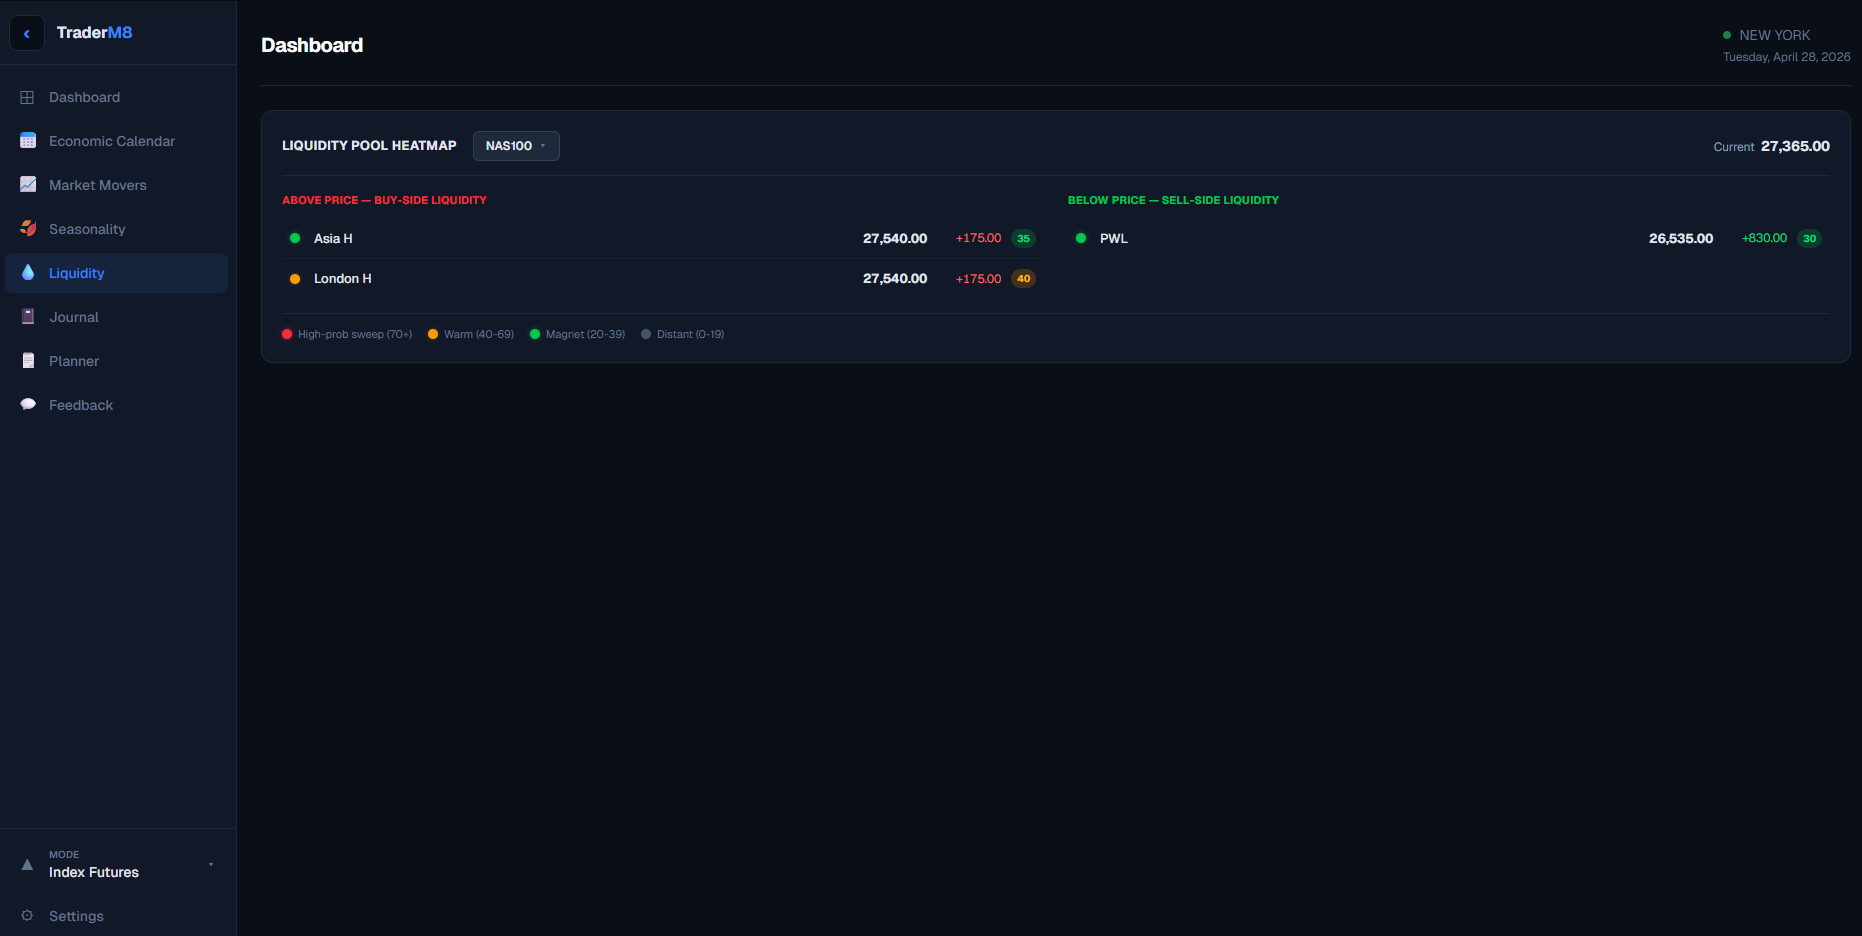
See where price is being drawn, not just where it is.
A live map of buy-side and sell-side liquidity pools tagged by source — PDH, PWL, equal highs, Asia high — sorted by distance and scored by likelihood of being the next sweep.
- Heat colour-coded: red high-prob sweeps stand out instantly.
- Filters out tapped levels so the list stays current.
- Per-instrument: NAS100, ES, Gold, Oil, BTC, EUR/USD and more.
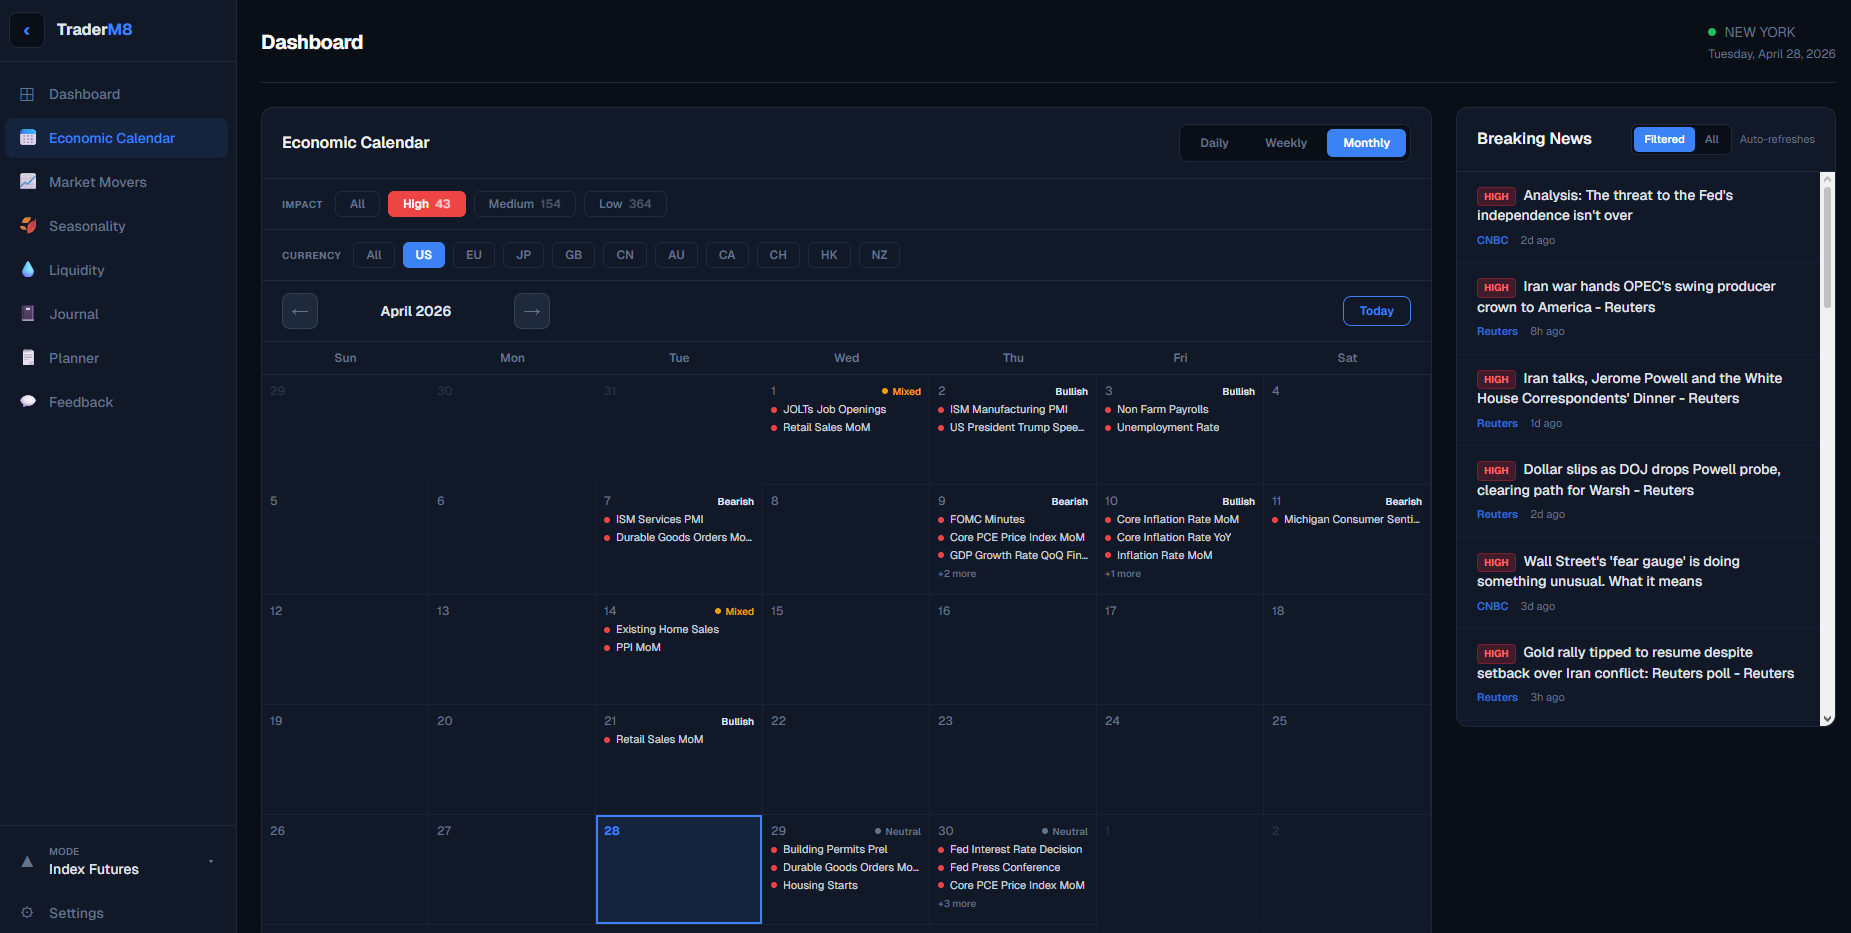
Filter the noise. Trade the events that actually move.
Multi-currency macro calendar with daily, weekly and monthly grids. Each event tagged HIGH / MED / LOW impact and Bullish / Bearish / Mixed bias. Side-panel Breaking News is relevance-scored — Reuters/Bloomberg up, listicle farms out.
- 10 most-traded currencies pinned to the filter row.
- Click a day → see every event with bias and forecast.
- Currency selection syncs to the home Next-Event countdown.
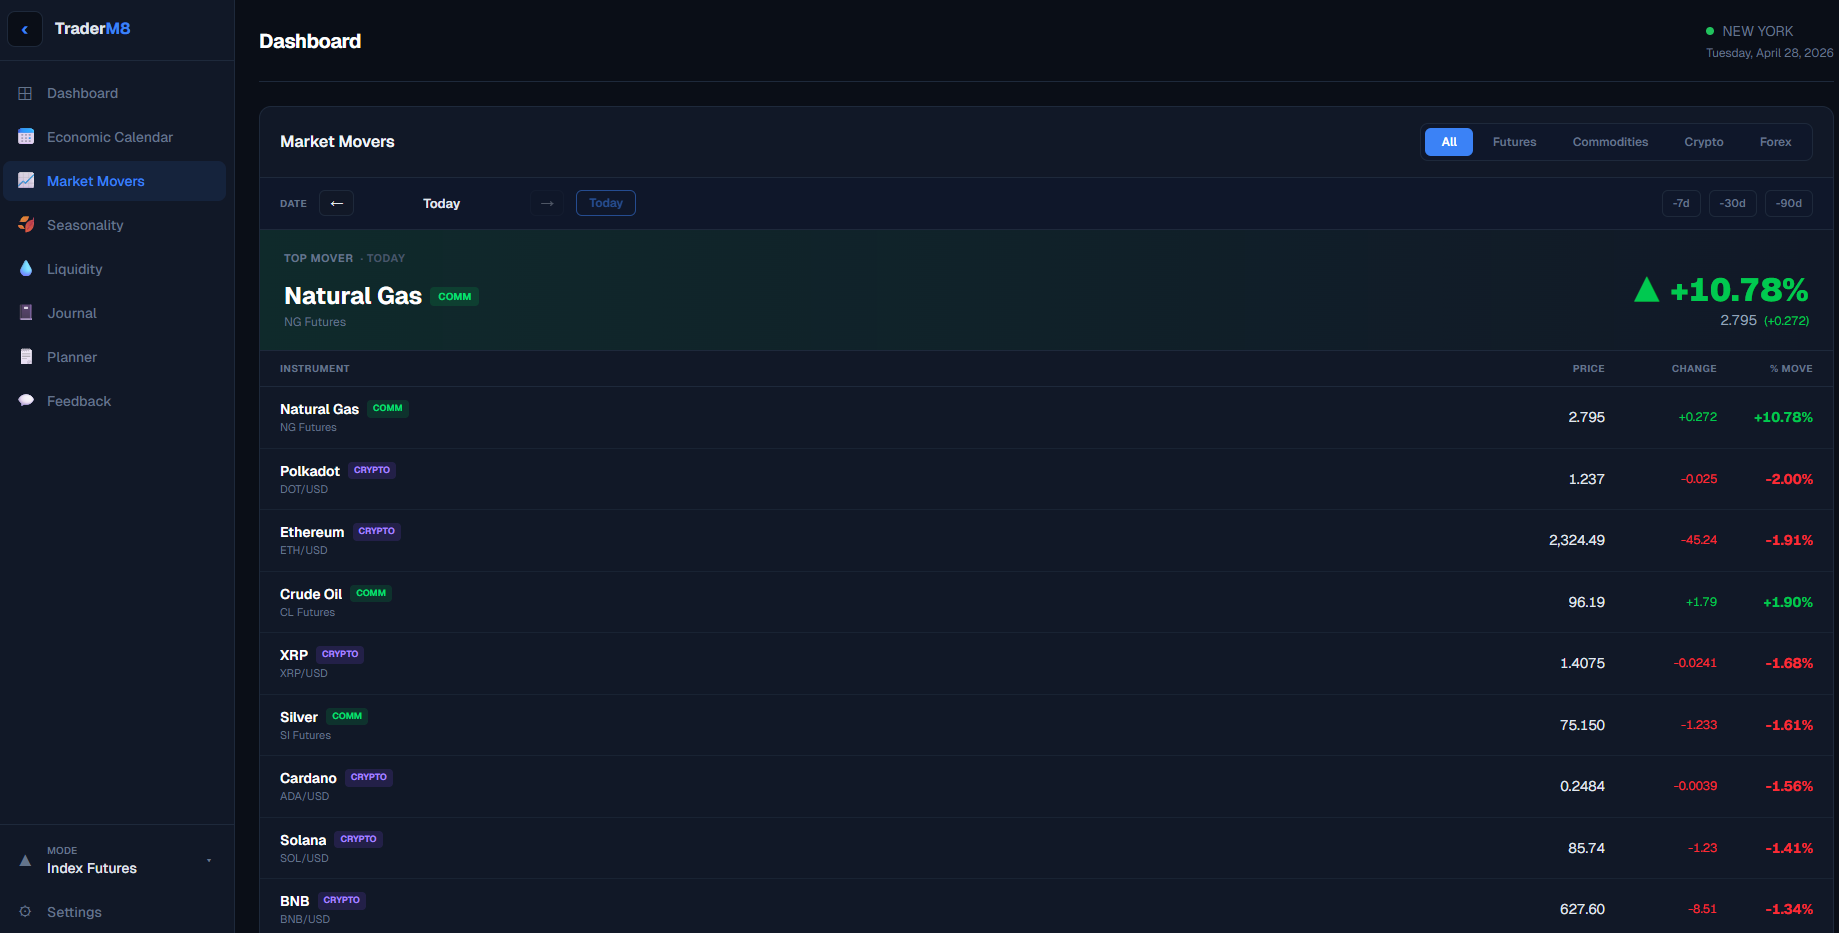
Spot the unusual stuff fast — across every asset class.
Today's biggest movers across futures, commodities, crypto and forex in one ranked list. The top mover gets a hero card; the rest fall in by absolute % move. Scrub the date back through the year to study previous big days.
- All / Futures / Commodities / Crypto / Forex tabs.
- 1-year date scrubber — instant lookup, no extra fetch.
- Cached at the edge so 1k users hit upstream as 1.
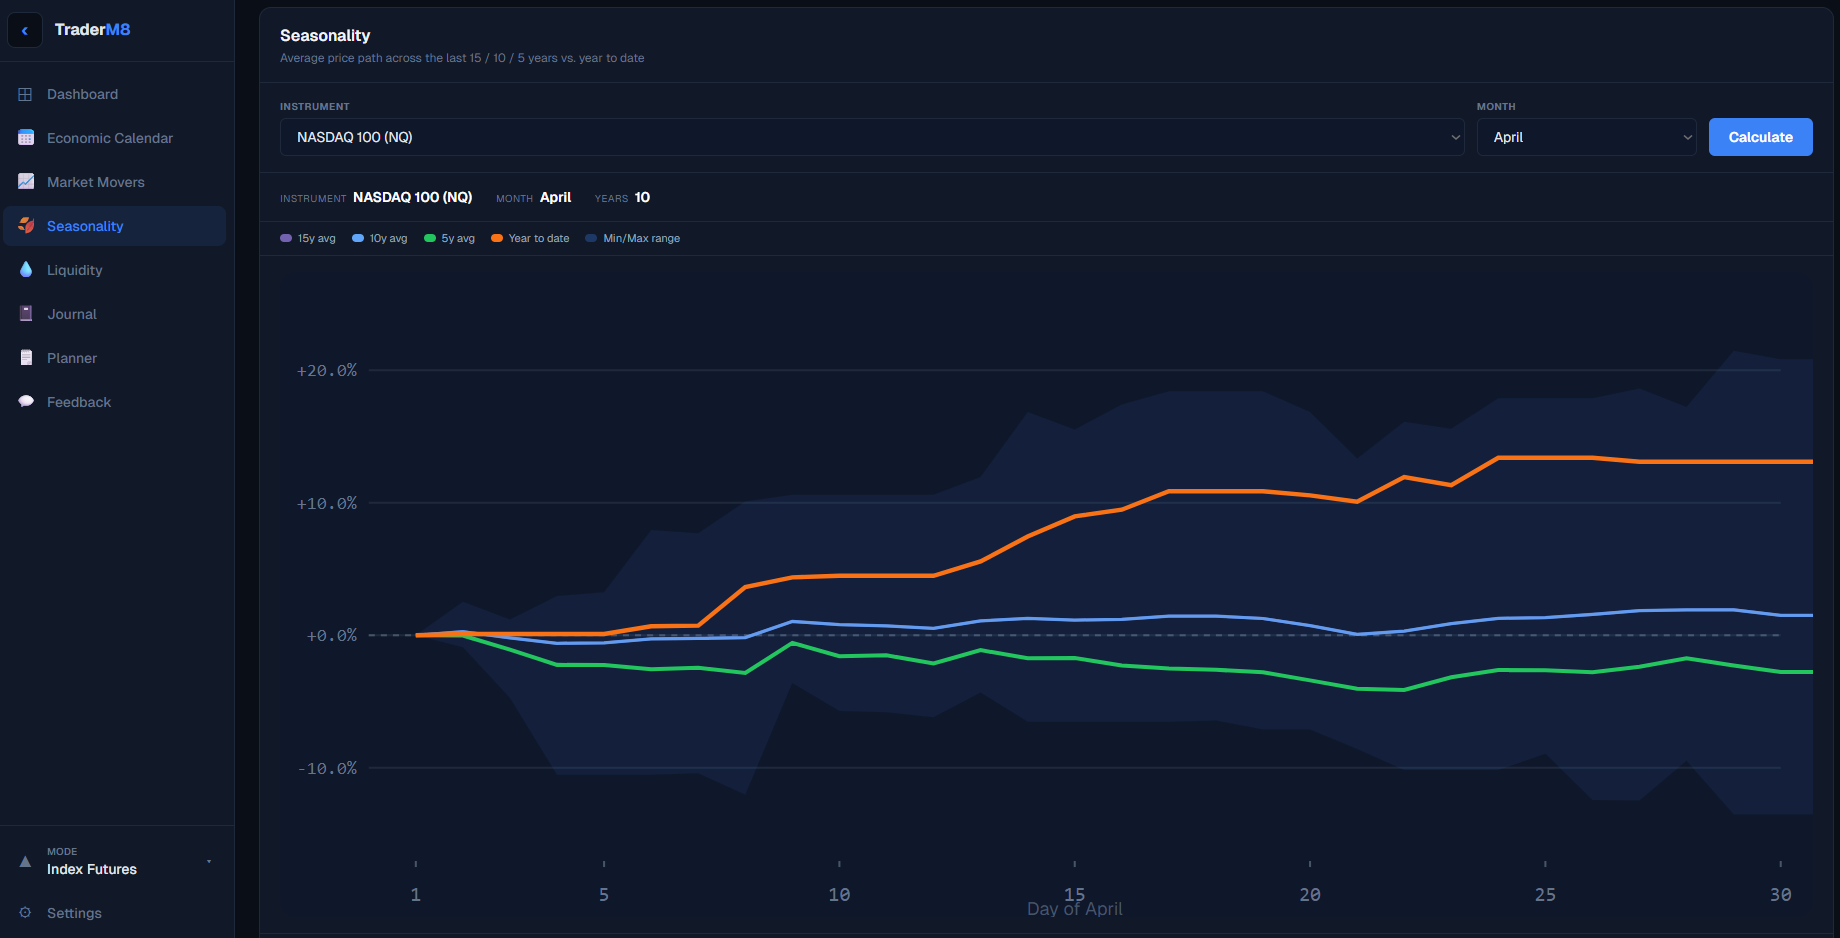
The seasonal patterns nobody on FinTwit talks about.
Average historical price path through any month for any instrument, layered 15-year, 10-year, 5-year and year-to-date. Hover the chart to read each line's exact percentage at any day. Stats card shows historical avg return, win rate, best/worst year. Past performance does not indicate future results.
- 30+ instruments — futures, commodities, FX, crypto.
- Min/max envelope band shows the historical extremes.
- Backtest your gut feel before you put real money on it.
Pop it onto your second monitor. Never miss size again.
Three inputs — contract, risk amount, stop in points — out comes the size, the dollar risk, and a clean R:R derivation. One-click pop-out lives in its own draggable window beside your charts.
- Single grouped dropdown for every contract you trade.
- Mode-aware: only shows the contracts for your active asset class.
- Pop-out window survives chart navigation and reloads.
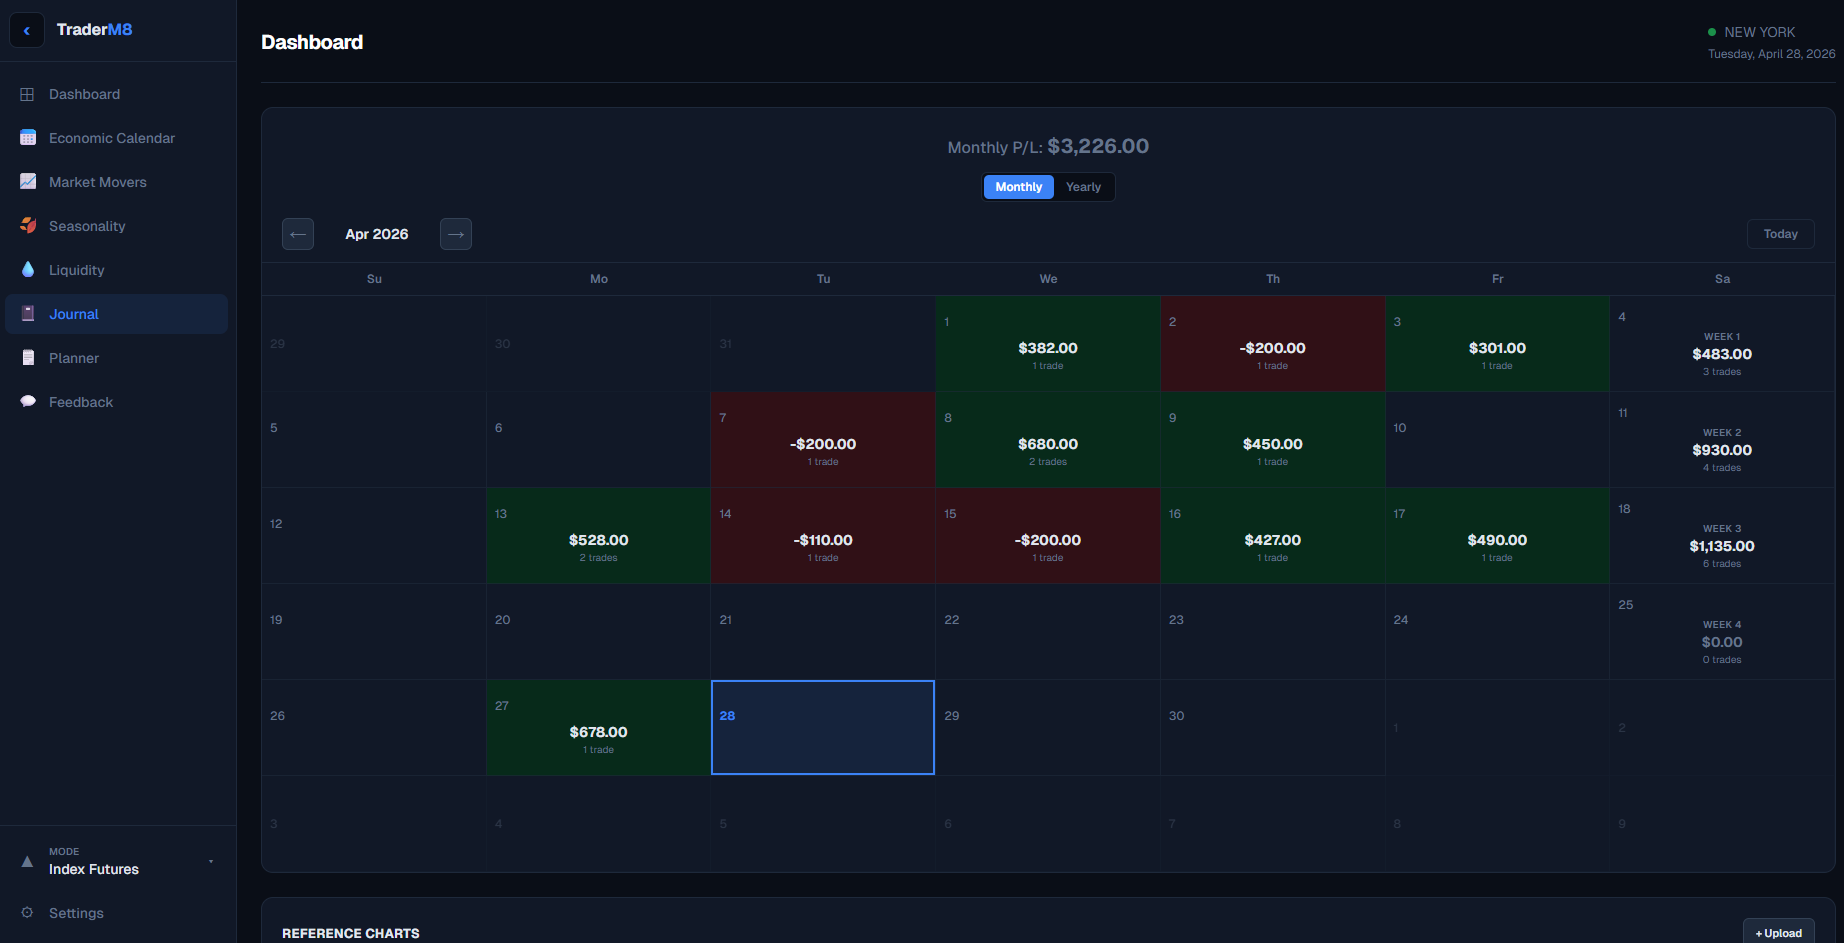
A journal that tells the truth, not the story you wanted.
Tap a day to log a trade. Watch the calendar fill in green and red. Weekly totals on the Saturday cell. Flip to yearly view for a 12-month grid. Scroll down for the equity curve, win rate, profit factor, max drawdown, day-of-week breakdown, streaks.
- Monthly + Yearly P/L views with calendar tile colouring.
- Per-week summary on every Saturday cell.
- Stats update live as you log — no spreadsheet glue.
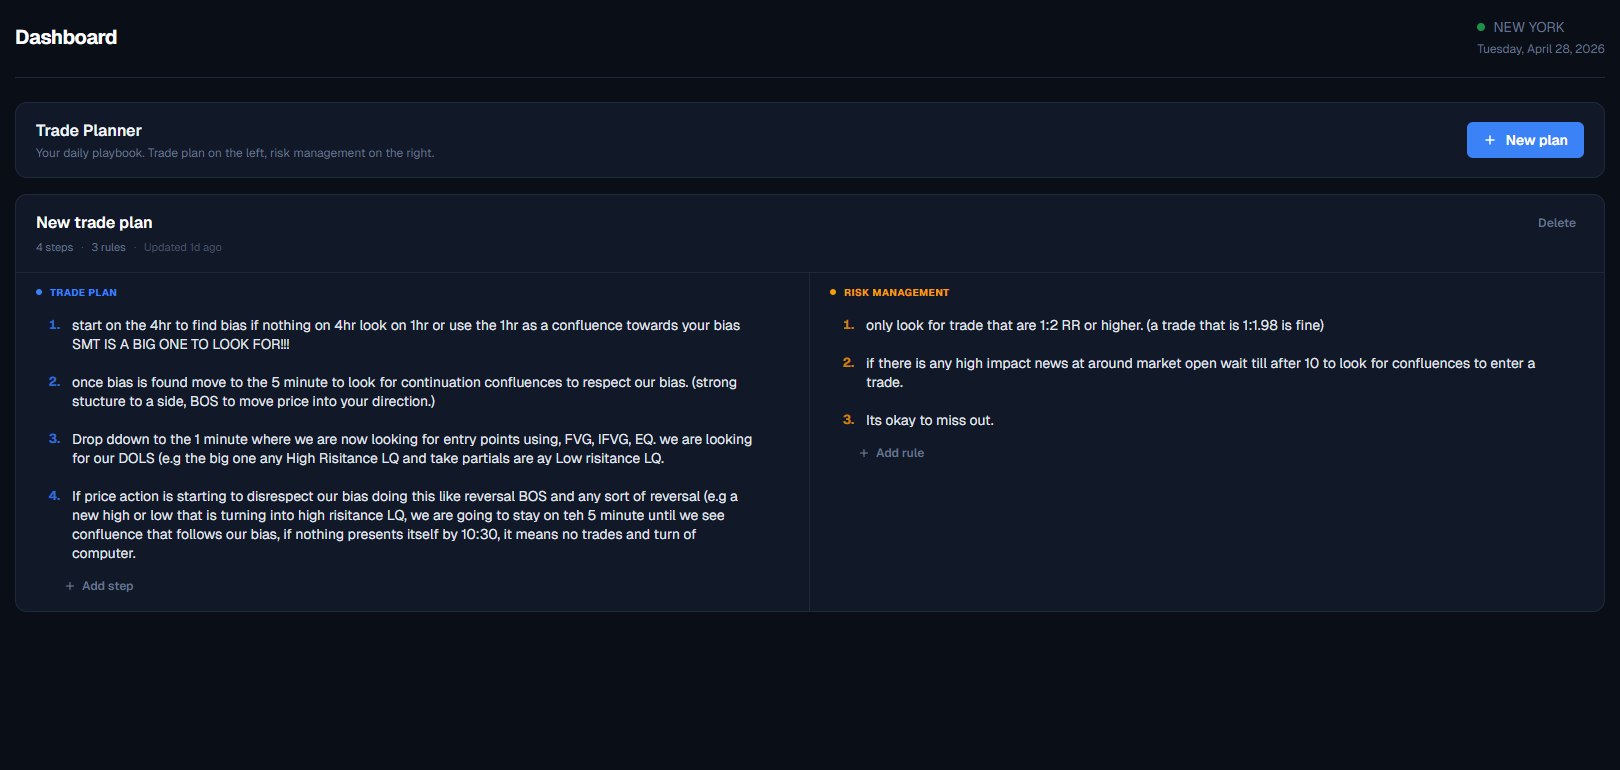
Your daily playbook on the same screen as your dashboard.
Two columns per plan — Trade Plan on the left, Risk Management on the right. Type the rules you actually follow, read them every morning, edit when something changes. No checkboxes pretending it's a to-do list.
- Numbered text rows, multi-line, auto-expanding.
- Per-plan title, multiple plans, sorted by most recent edit.
- Synced to your account across every device you sign in on.
Like what you see?
Create a free account and the whole desk is yours. No card required, instant access.